Figure 3.
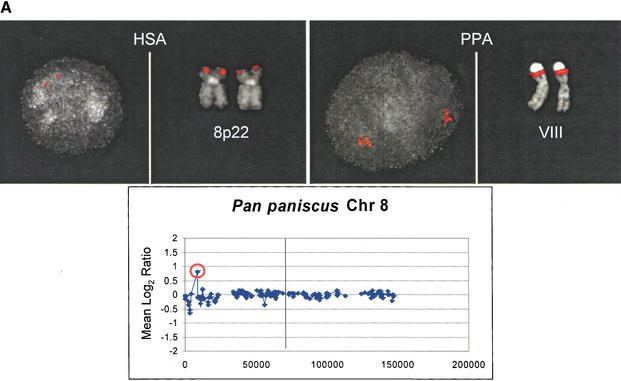
Comparative FISH Validation of duplications. Interphase and metaphase images are presented for three array CGH duplications verified by FISH; all signals are shown in red. Array CGH results for an individual of the respective primate species are shown below each FISH comparison, with the variant BAC used as a probe in each respective FISH experiment circled in red. The x-axis represents the map position in megabases along the chromosome and the y-axis represents the Log2 ratio. The p-telomere is oriented to the left in each plot, and the q-telomere to the right. The centromere is indicated as a vertical line. An intrachromosomal duplication of RP11-218N24 is confirmed in bonobo when compared with human (A). Similarly, a gorilla intrachromosomal duplication is illustrated by interphase FISH using probe RP11-64I2 in contrast to the single signal on human 7p14 (B). Extensive interchromosomal duplication of BAC RP11-88L18 is shown for orangutan acrocentric chromosomes when compared with the unique 5p15 human locus (C). See Table 1 for more details.


