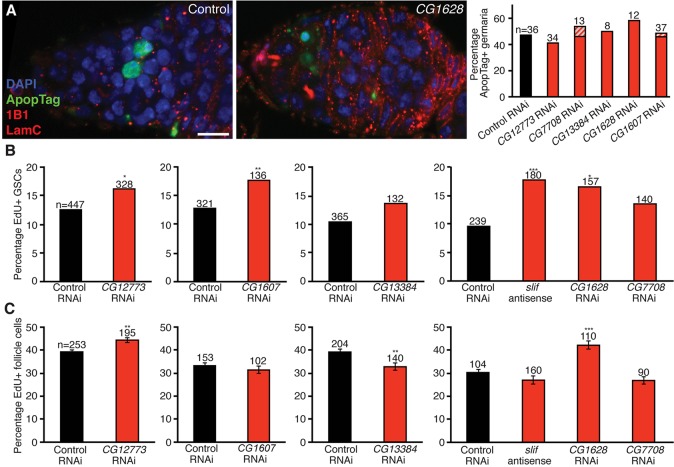
Fig. 5.
Reduced amino acid transport in adipocytes does not affect cell death within the germarium, but causes a slight increase in GSC proliferation. (A) Germaria from females at 10 days of adult adipocyte-specific knockdown of CG1628 or white control showing some occurrence of cell death (ApopTag, green) in both cases. DAPI (blue) labels nuclei; 1B1 (red) labels fusomes; LamC (red) labels cap cell nuclear envelopes. Scale bar: 10 μm. In the graph on right, bars represent the percentage of germaria containing ApopTag-positive cells, with the hatched region indicating the fraction of those displaying ApopTag adjacent to GSC niche. The number of germaria analyzed is shown above each bar. (B,C) Frequencies of GSCs (B) or follicle cells (C) in S phase, based on EdU incorporation, at 10 days of adipocyte knockdown of amino acid transporters or GFP control. Number of GSCs (B) or follicle cell fields (C) analyzed is shown above each bar. *P<0.05; **P<0.01; ***P<0.001, Student's t-test. Data shown as mean±s.e.m.

