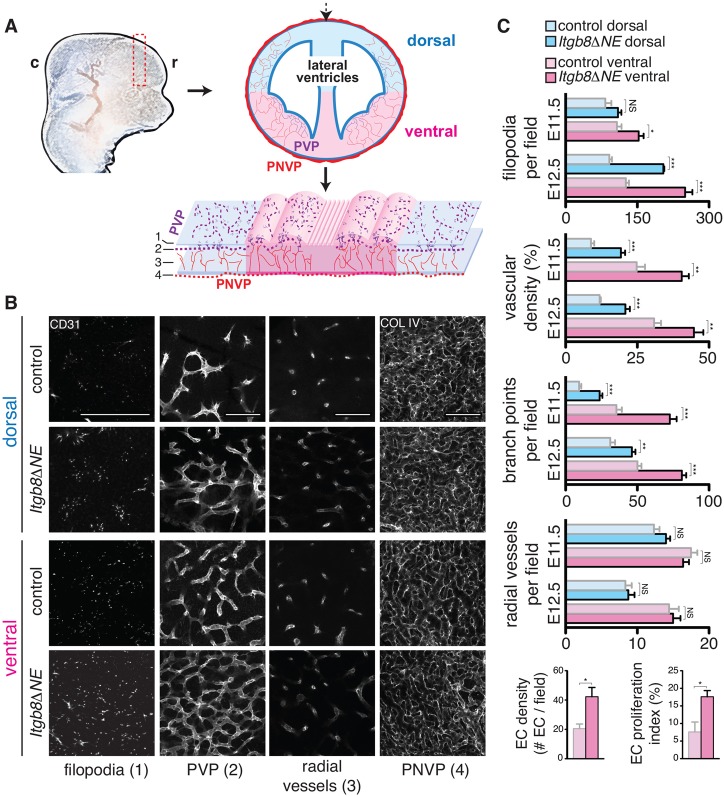
Fig. 2.
Increased vascular sprouting and branching before hemorrhage in Itgb8ΔNE mutants. (A) Diagram illustrating neuroepithelial flat-mounts used to analyze vascular sprouting and branching in the telencephalon. c, caudal; r, rostral. (B) E11.5 coronal sections (dashed red rectangle in A) were immunostained, cut dorsally (dashed black arrow in A) and flattened. Vessels were visualized at depths (1-4) indicated in bottom panel of A: (1) vascular filopodia extending to the ventricular surface, (2) PVP in the subventricular zone, (3) radial sprouts from the PNVP leading to PVP vessels and (4) pia-associated PNVP. Images illustrate increased densities of endothelial cell filopodia, vascular branch points and total vascular coverage in mutants versus controls (see supplementary material Movies 1 and 2). The number of radial sprouts (3) and the appearance/organization of the PNVP (4) appear similar in both. Scale bars: 100 μm. (C) Quantitative analysis of E11.5 and E12.5 flat-mounts (images not shown): filopodia number/field, vascular density, vessel branch points/field, radial vessels connecting PNVP to PVP per field. Endothelial cell number (Erg+ endothelial nuclei per 100 μm vascular length) and endothelial proliferation index (percentage of Erg+ nuclei labeled by BrdU; see supplementary material Fig. S2). Quantification reveals spatio-temporal PVP sprouting and branching angiogenesis gradients in controls with increased vascular sprouting, and branching and endothelial proliferation in mutants before and with hemorrhage. P-values from Student's t-test: *P<0.05, **P<0.005, ***P<0.0005; NS, not significant. N=4 controls, four mutants per time point. Error bars indicate s.e.m.

