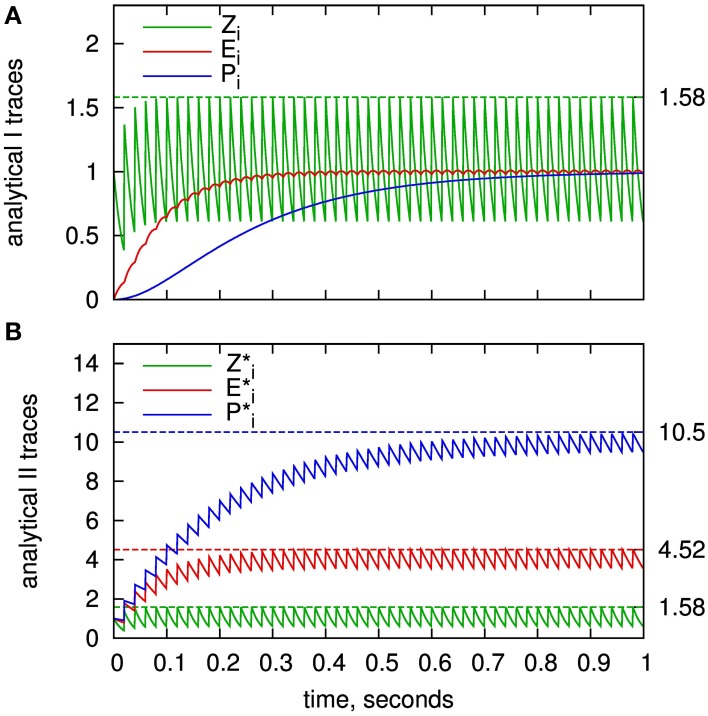
Figure 5.
Value range estimation of the BCPNN states variables: Traces of the Z, E, and P states for a regular spike train with frequency of 50 HZ. (A) Presynaptic traces according to the standard analytical solution (analytical I), as expressed in Equations (7–9). (B) Exponential traces of the improved analytical solution analytical II, Equations (32–34). Analytically calculated limits according to Equation (59) are plotted as dashed lines. Time constants used here: τzi = 20 ms,τe = 80 ms and τ*p = 200 ms.

