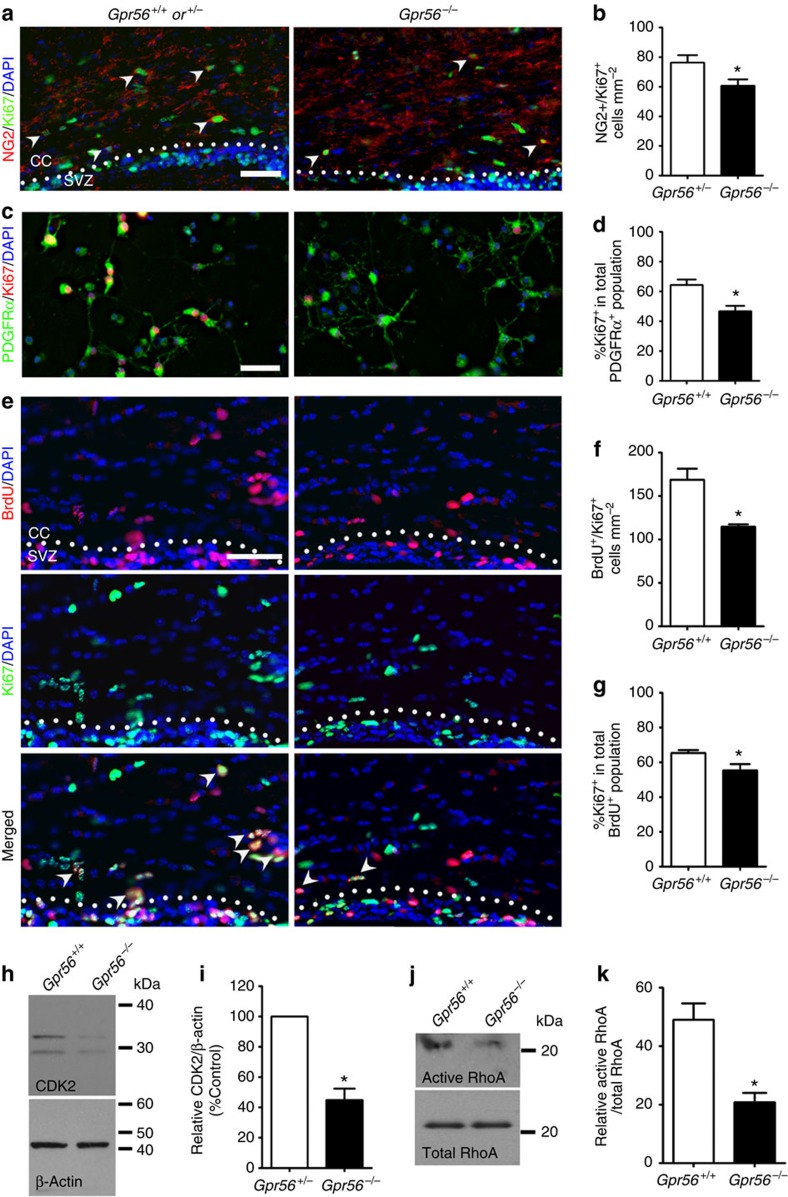
Figure 5. Loss of GPR56 leads to fewer proliferating OPCs.
(a) Representative images of NG2 (red) and Ki67 (green) double IHC in the CC of Gpr56+/− and Gpr56−/− P14 mice. Arrowheads indicate double-positive cells. (b) Quantification of NG2 and Ki67 dual-positive cells. The asterisks represent significance based on unpaired t-test. P=0.0382; n=6 per genotype. (c) Representative images of PDGFRα (green) and Ki67 (red) double immunostaining on OPCs after cultured for 4 days in proliferation media. (d) Quantification of PDGFRα and Ki67 dual-positive OPCs. The asterisks represent significance based on paired t-test. P=0.0156; n=3 per genotype. (e) Representative images of BrdU (red) and Ki67 (green) double staining on P14 Gpr56+/+ and Gpr56−/− brains that were pulsed with BrdU 24 h before. Arrowheads indicate double-positive cells. (f) The number of BrdU and Ki67 double-positive cells was quantified in the CC of Gpr56−/− mice compared with controls. The asterisks represent significance based on unpaired t-test. P=0.0153; n=3 per genotype. (g) The percentage of Ki67+ in the total BrdU+ cell population was quantified in the CC of Gpr56−/− mice compared with the Gpr56+/+ controls. The asterisks represent significance based on unpaired t-test. P=0.0289; n=4 per genotype. (h) Western blot depicting CDK2 protein level in actually isolated OPCs from Gpr56+/+ and Gpr56−/− P6 mice. (i) The relative CDK2 protein levels were shown. The asterisks represent significance based on paired t-test. P=0.0179; n=3 per genotype. (j) Western blot of active RhoA (top panel) and total RhoA (bottom panel) in the optic nerves of Gpr56+/+ and Gpr56−/− mice. (k) The relative level of active RhoA to total RhoA was presented. The asterisks represent significance based on unpaired t-test. P=0.0122; n=3 per genotype. CC, corpus callosum; SVZ, subventricular zone. Scale bar, 50 μm. Error bars are means ± s.e.m.

