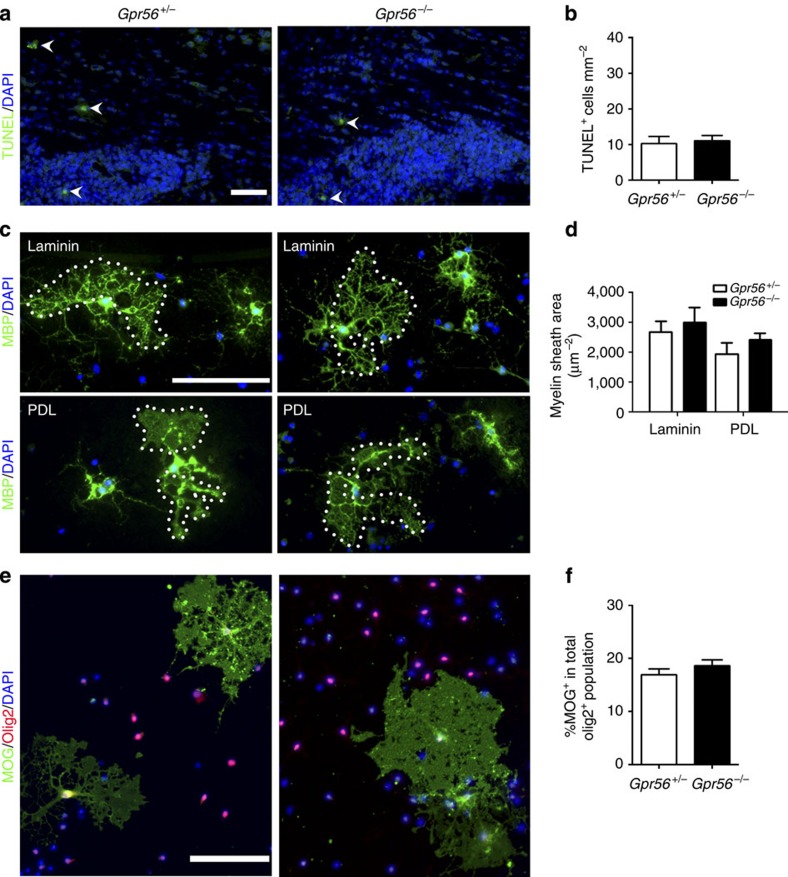
Figure 6. Loss of GPR56 has no effect on OPC survival, OL process elaboration and maturation.
(a) Representative images of TUNEL+ cells (green; arrowheads) in the SVZ and CC of Gpr56+/− and Gpr56−/− mice at P14. Scale bar, 50 μm. (b) Quantification of TUNEL+ cells. P=0.7573; unpaired t-test, n=6 per genotype. (c) Representative images of MBP+ (green) OLs cultured for 7 days on either laminin (upper panel) or poly-D-lysine (PDL, lower panel) in differentiation media. Scale bar, 100 μm. (d) Quantification of myelin sheath area of OLs cultured on laminin (P=0.2043) or PDL (P=0.3027) (paired t-test, n=3 per genotype). (e) Representative images of MOG (green) and Olig2 (red) double labelling on OLs derived from Gpr56+/− and Gpr56−/− mice cultured for 7 days in differentiation medium. Scale bar, 100 μm. (f) Percentage of differentiated OLs (MOG+) in total OLs (Olig2+) was quantified. P=0.5044; paired t-test, n=3 per genotype. Error bars are means ± s.e.m.

