Figure 6.

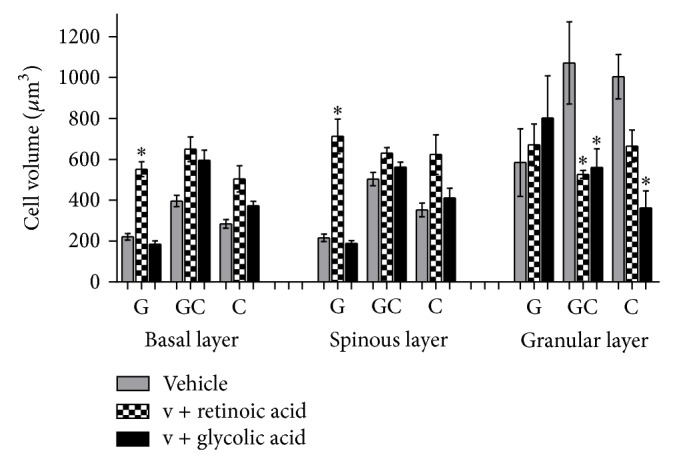
Mean values of cell volume obtained by the treatment with the active substances in different formulations (ANOVA, n = 5 measurements, mean ± SEM). *Significantly different from the vehicle treated area (P < 0.001).

Mean values of cell volume obtained by the treatment with the active substances in different formulations (ANOVA, n = 5 measurements, mean ± SEM). *Significantly different from the vehicle treated area (P < 0.001).