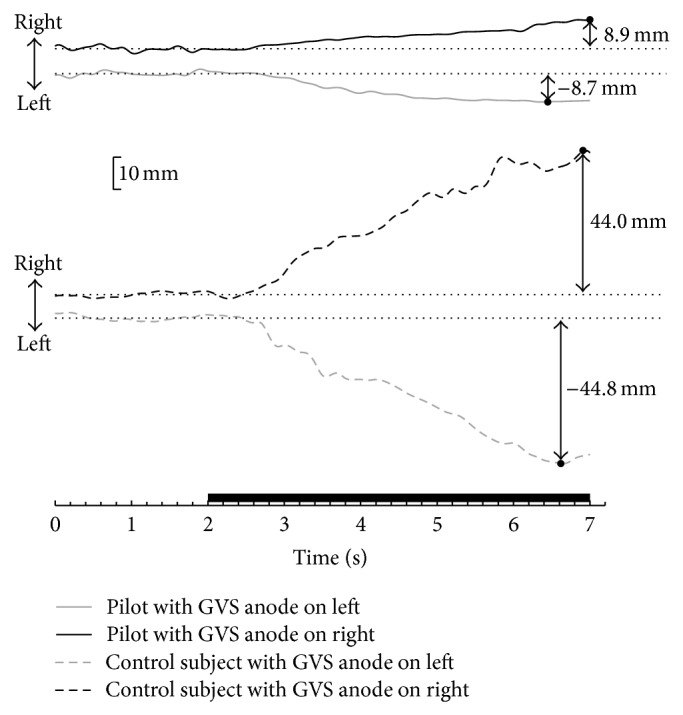
Figure 1.

Center of pressure (COP) displacement in the medial-lateral direction of one pilot (solid line) and one control subject (dashed line) before and during a 5 s pulse of 1.0 mA GVS. The thick line on the x-axis indicates when GVS was applied. The dotted line stands for the average COP position during the prestimulus period, and the black dot stands for the peak COP position during the stimulus period.
