Figure 1.

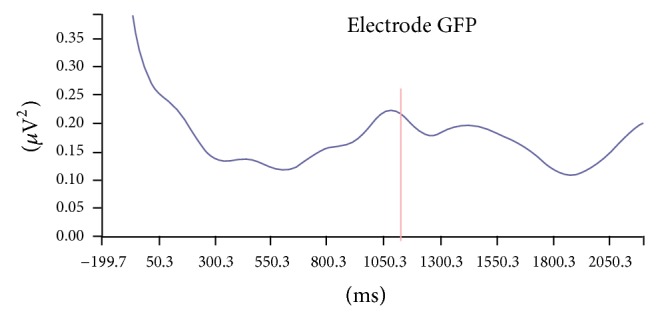
Power oscillation study for predetermined bands (beta band power, 20 Hz)—induced band power. A band power peak of 0.222 μV2 is found, occurring 1087 ms after the appearance of the first stimulus (S1)—induced band power analysis.

Power oscillation study for predetermined bands (beta band power, 20 Hz)—induced band power. A band power peak of 0.222 μV2 is found, occurring 1087 ms after the appearance of the first stimulus (S1)—induced band power analysis.