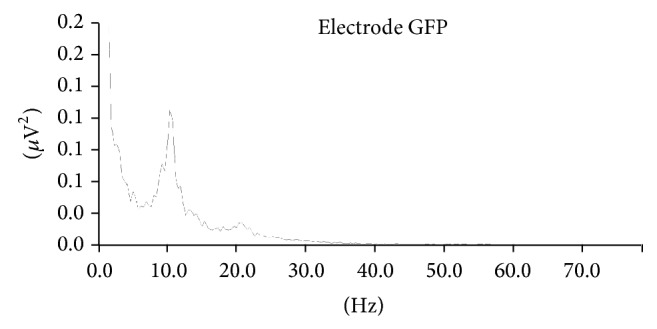
Figure 2.

“Band power spectrums” study in the “frequency domain” (simple band power). The figure shows band power peaks for two bands of interest: alpha (frequency 10.38 Hz and 0.109 μV2 of power) and beta (frequency 20.76 Hz and 0.018 μV2 of power).
