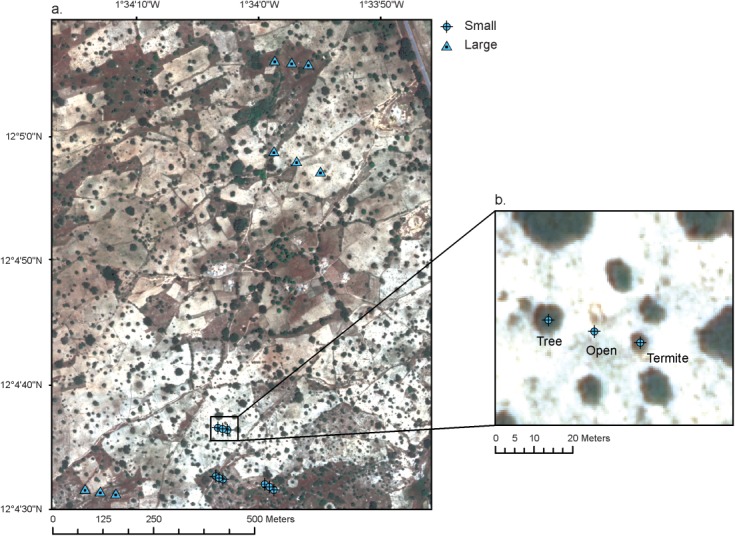
Figure 1.

Study area: (a) location of the 18 sampling positions. Groups of three points correspond to a transect, with triangle symbols indicating points located in large open areas (lower tree densities) and circles in small open areas (higher tree densities). (b) Detail of a transect located in a small open area with its three sampling positions (tree: under a Shea tree; open: center of the open area; termite: under a Shea tree associated with a termite mound).
