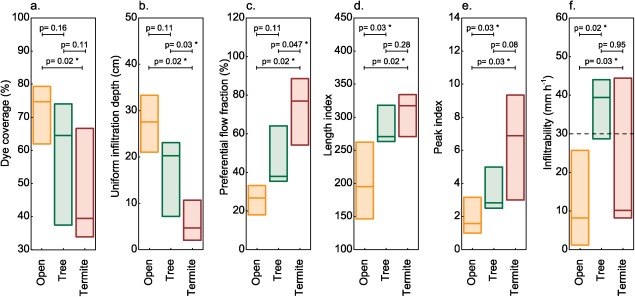
Figure 4.

Boxplots (median, first, and third quartile; n = 6) of the different measured variables ((a) dye coverage, (b) uniform infiltration depth, (c) preferential flow fraction, (d) length index, (e) peak index, and (f) steady state infiltrability) in the different positions (open: center of open areas; tree: under Shea trees; termite: under Shea trees associated with termite mounds). P values for the Wilcoxon sign ranked test are also shown. The dashed line in Figure 4(f) indicates the rainfall intensity above which 50% of the total rainfall falls in Ouagadougou [Hoogmoed and Stroosnijder, 1996].
