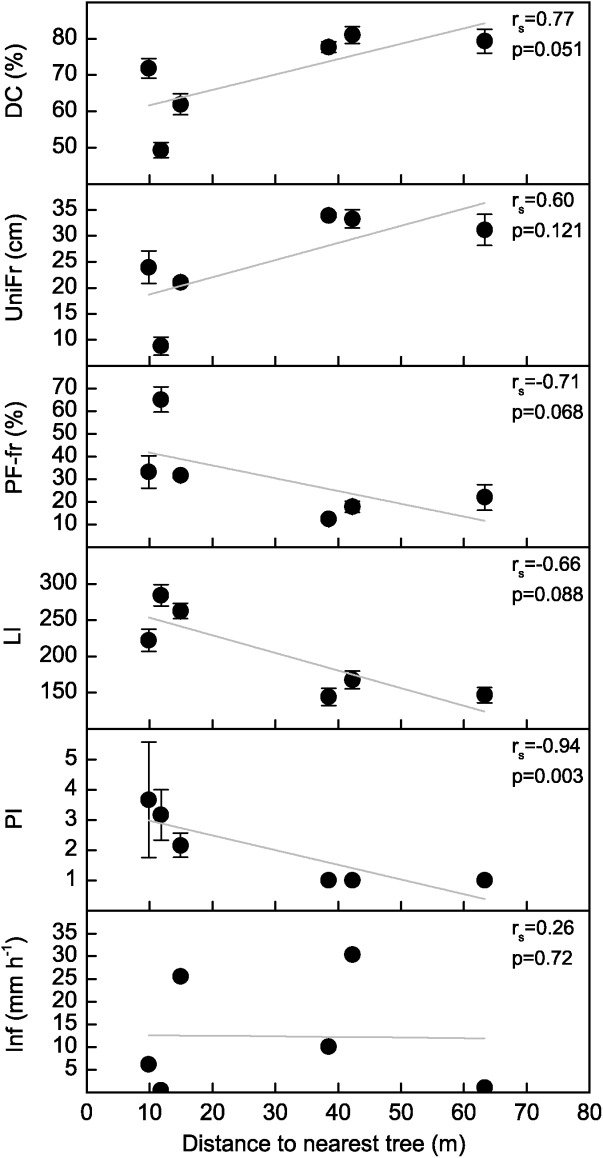
Figure 5.

Scatterplot of the different preferential flow indicators (DC: dye coverage (%); UniFr: uniform infiltration depth (cm); PF-fr: preferential flow fraction (%); LI: length index; PI: peak index) and steady state infiltrability (Inf) versus distance from the sampling point to the nearest tree stem for the open areas (n = 6). Error bars indicate standard error of the mean (n = 6, only for preferential flow indicators). Spearman's rho statistic (rs) and P values for the Spearman's correlation test are shown. A linear regression is also shown for illustrative purposes only.
