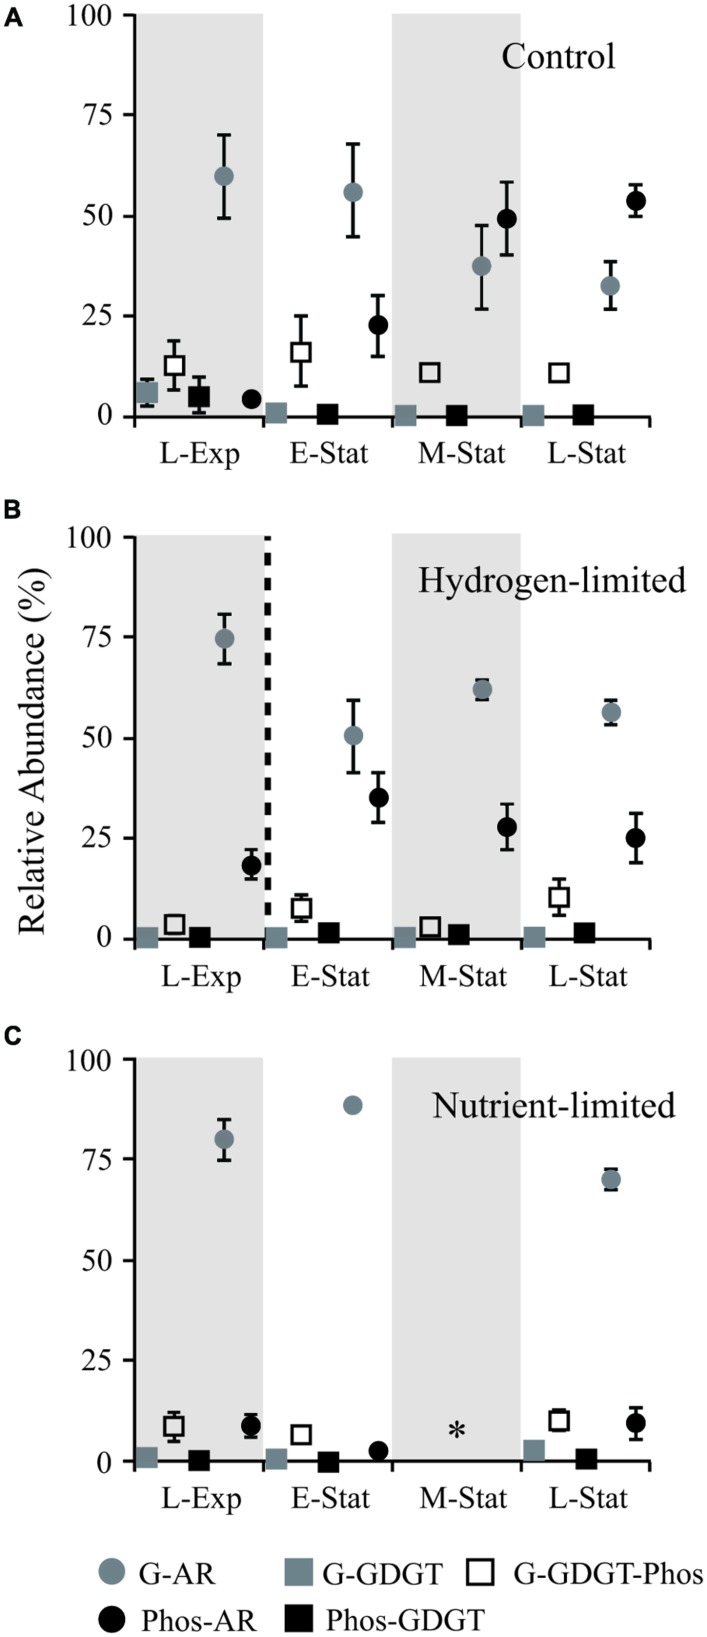
FIGURE 1.
Abundance of IPL relative to total lipids (including both core and IPL) during growth of Methanothermobacter thermautotrophicus under control (A), hydrogen limiting (B), and nutrient limiting (C) conditions at: late exponential phase (L-Exp), early, mid and late stationary phases (E-, M-, and L-Stat). The dashed line in (B) denotes the change in headspace from 80:20 H2:CO2 to N2:CO2 (vol:vol) 3 h before sampling E-Stat in hydrogen-limited experiments. Star symbol (*) in (C) represents no data. The experiments were conducted in triplicate and error bars represent standard error of the mean. G, glycosidic; Phos, phosphatidic; AR, archaeols/diethers; GDGT, tetraethers.

