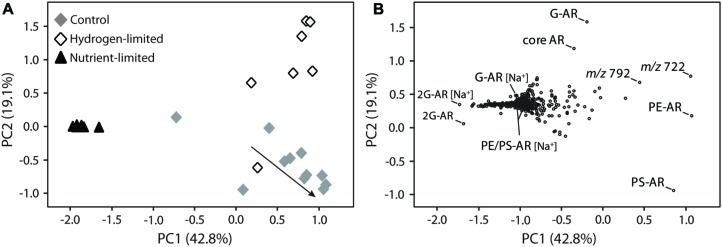
FIGURE 3.
Principal component analysis (PCA) of M. thermautotrophicus growing under control, hydrogen-limited and nutrient-limited conditions. Bi-plots of two main principal components, PC1 and PC2, displayed as (A) samples from distinct treatments and (B) lipid distribution. The arrow in (A) illustrates control samples transitioning from late exponential growth to stationary phase. [Na+] indicates IPL bound to sodium and masses m/z 722 and 792 represent the most abundant unmodified polyprenols (B), respectively, containing 10 and 11 isoprene units (see Supplementary Figure S4). For compounds abbreviations and detailed information on the PCA analysis please refer to Supplementary Table S1 and Section “Materials and Methods,” respectively.

