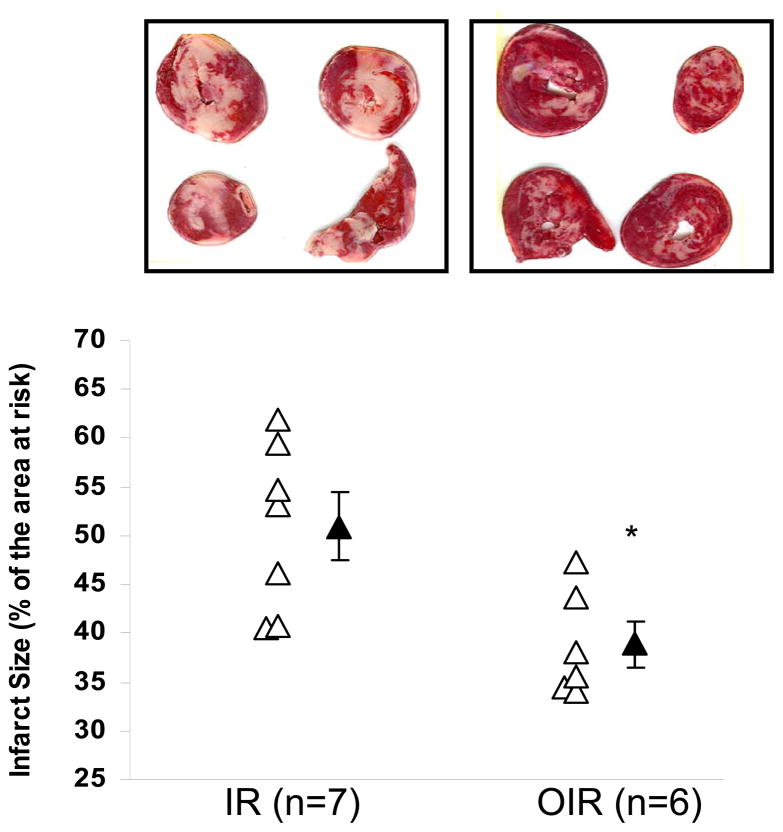
Figure 5. Ouabain (100nM) pretreatment reduces infarct size after ischemia-reperfusion.
Top: representative picture of staining with TTC (viable tissue is red). Bottom: plot of infarct size as a percentage of the area at risk (equivalent to whole myocardium) for control (IR) and ouabain-treated heart (OIR). Open symbols depict individual values while solid symbols depict group means ± SEM of 7 independent experiments for each group. * P<0.05 vs. IR

