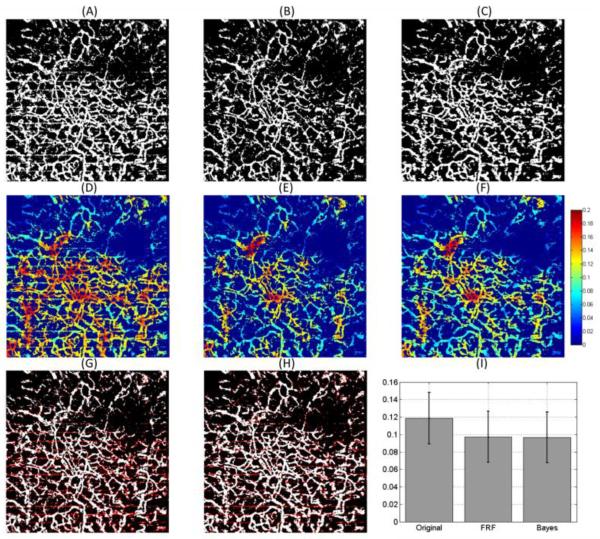
Figure 6.
(A) Binary representation of Figure 2(A). (B) Binary representation of Figure 5(A). (C) Binary representation of Figure 4(F). (D) Vessel length fraction calculated from (A). (E) Vessel length fraction calculated from (B). (F) Vessel length fraction calculated from (C). (G) Overlap of (A) and (B). (H) Overlap of (A) and (C). The white pixels indicate the pixels that appear in both images and the red pixels are the white pixels that appear in (A) but not in (B) or (C). (I) Mean and standard deviation of the vessel length fraction calculated in (D), (E) and (F).

