Figure 7.
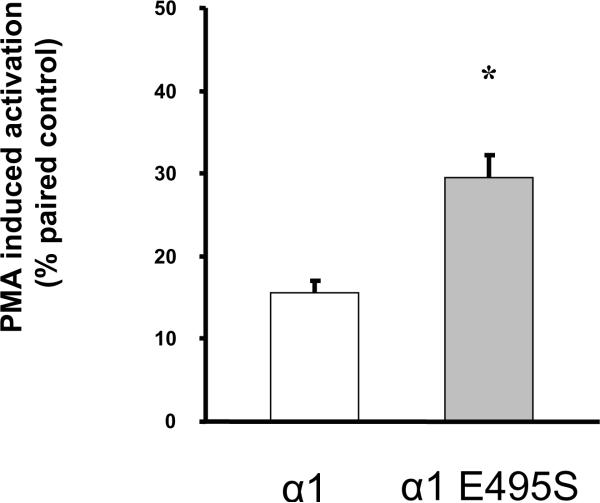
Effect of the E495S mutation on surface expression and PMA-dependent activation of α1 Na,K-ATPase mediated Rb+-transport. A. Total abundance of rat α1 and α1- E495S in transfected OK cells. The upper panel depicts typical immunoblots of cell lysates probed with antibodies specific for α1 and actin. The lower panel depicts the pooled data relative to α1, represented as means ± SEM (n = 3). Values were compared using bilateral Student's t-test and no significant difference was observed. B. Surface expression of rat α1 and α1- E495S in transfected OK cells. The upper panel depicts a typical immunoblot of biotinylated membrane proteins recovered by affinity purification with streptavidin. The lower panel depicts the pooled data relative to α1, represented as means ± SEM (n = 3). Values were compared using bilateral Student's t-test. * P<0.05 vs α1. C. Na,K-ATPase-mediated transport was assayed in attached cells by measuring the ouabain-sensitive uptake of the K+ congener, 86Rb+. PKC activation was induced by a 5 min exposure of the cells to 10 μM PMA prior to the addition of Rb+, and compared to paired control plates of cells exposed for 5 min to the same amount of vehicle alone (DMSO). Values are means ± SEM (n = 5) of uptake induced by PMA exposure, expressed in percent of their paired controls (same transfection group, same passage, same day). Values were compared using bilateral Student's t-test. * P<0.05 vs the corresponding wild-type α1.


