
Figure 2. (Brain Location #2).
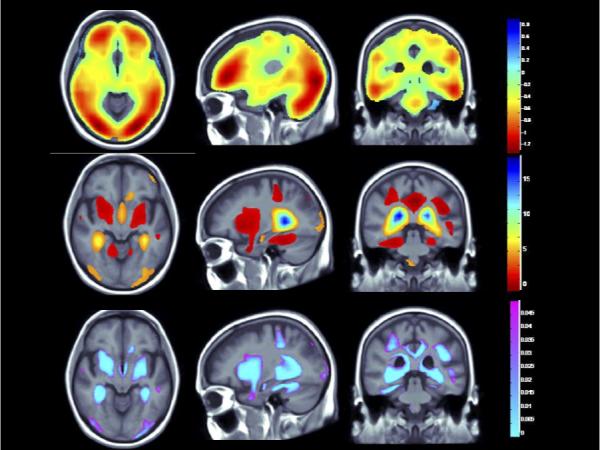
(Top panel) Whole brain 3D maps show areas where regional brain volumes correlated significantly with BMI after controlling for site, age, sex, race, educational level, and diagnosis, plus PA (N = 963; FDR q = 0.05, critical uncorrected P = 0.0398). (Middle panel) Maps show brain regions significantly associated with diagnosis (AD/MCI v. Controls) after correcting for the same effects, plus BMI (N = 963; FDR q = 0.05, critical uncorrected P = 0.0047). Beta maps were significant after standard correction for multiple comparisons and represent the estimated degree of tissue excess or deficit at each voxel, as a percentage, for each unit gain in BMI and/or positive diagnosis (AD/MCI). (Lower panel) 3D maps show regions of significant brain volume differences from both higher BMI and the positive diagnosis (AD/MCI) using a conjunction analysis displayed over a study-specific template. P maps are corrected for multiple comparisons on the basis of FDR (FDR q-level = 0.05, critical uncorrected P = 0.0008). The same slices are shown in each panel and images are displayed in radiological convention (left side of the brain shown on the right).