
Figure 4. Ab initio model of PACS-1 FBR.
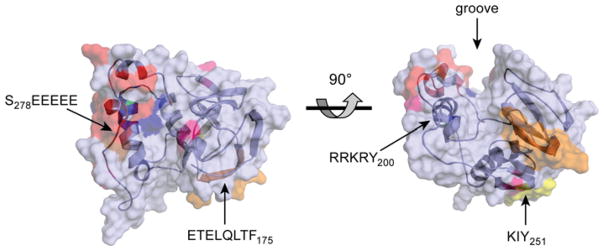
Ab initio modelling of the PACS-1 FBR (residues 117–300) was performed using Rosetta++ [177] and the predicted structure was energy minimized using Insight II (Accelrys Insight II modelling software). The tertiary structure is represented as a ribbon diagram surrounded by a semi-transparent surface projection. Acidic residues are coloured red, basic residues are coloured blue, residues required for adaptor binding are coloured orange, residues required for GGA binding are coloured yellow and residues positively selected through evolution are coloured pink. Left-hand panel, top view looking down on the major groove. Right-hand panel, the image is rotated 90° towards the viewer. Images were created using PyMOL (DeLano Scientific; http://pymol.sourceforge.net/). An interactive three-dimensional version of this Figure is available at http://www.BiochemJ.org/bj/421/0001/bj4210001add.htm.