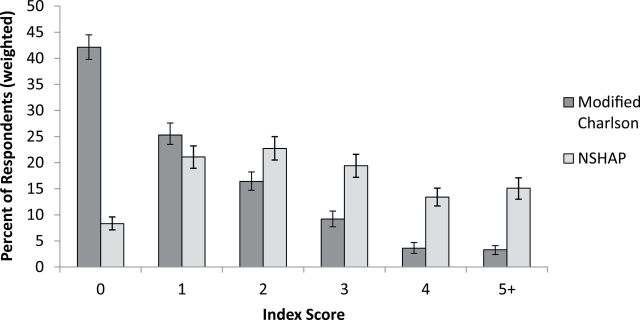
Figure 1.

Distribution of comorbidity indices. Each bar represents the percent of respondents with that index score, with separate bars for the Modified Charlson Comorbidity Index and the NSHAP Comorbidity Index. Error bars represent 95% confidence intervals.
