
Figure 6.
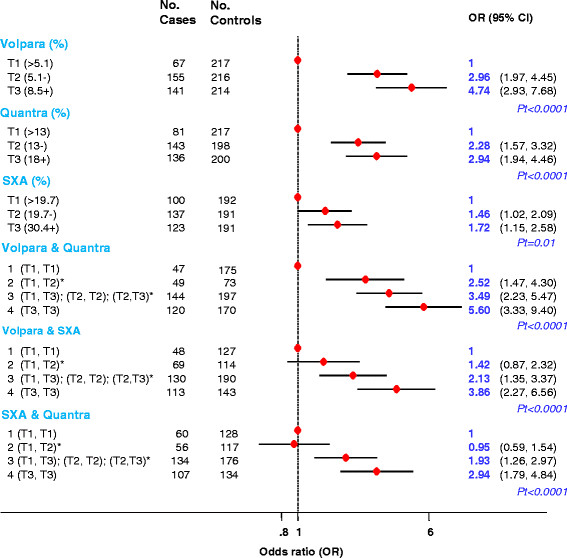
Breast cancer risk associated with aggregated scores produced by combining readings from two fully-automated volumetric methods. *Aggregated categories based on tertiles as defined among control women: 1: if classified in the bottom tertile (T1) by both methods; 2: if classified in T1 by one method but in the middle tertile (T2) by the other; 3: if classified in T1 by one method but in the top tertile (T3) by the other, or in T2 by both methods, or in T2 by one method but in T3 by the other; 4: if classified in T3 by both methods. OR, odds ratio; Pt, P for linear trend; SXA, single energy x-ray absorptiometry.