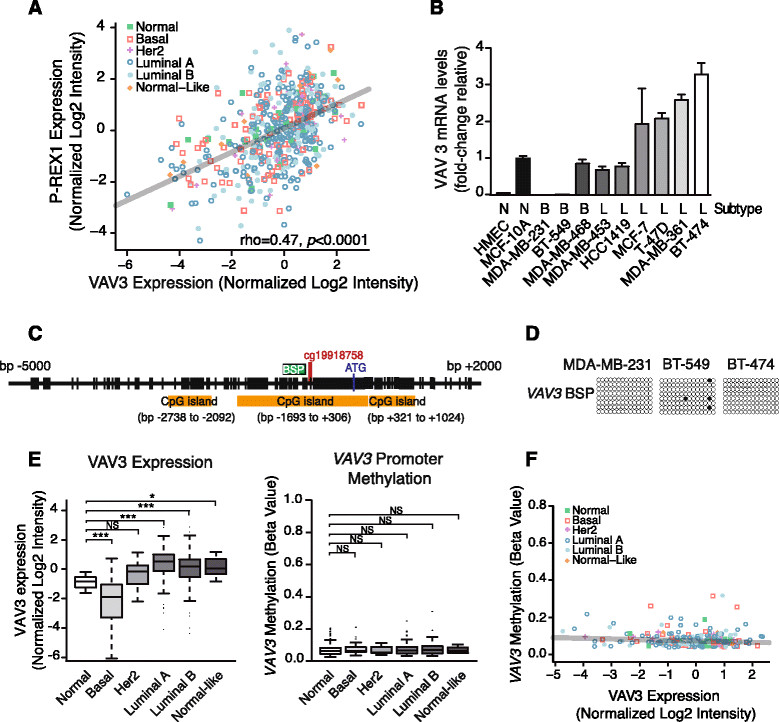
Figure 6.

VAV3 expression is not regulated by promoter methylation. Panel A . Correlation analysis for P-REX1 and VAV3 expression in breast tumors and normal breast tissue was obtained from the TCGA database (Spearman rho =0.47, P <0.0001). Panel B . Quantitative PCR determination of VAV3 mRNA levels in human breast cancer cell lines, normalized to those in immortalized normal breast epithelial cells, MCF-10A cells. Data are expressed as mean ± S.D. of triplicate samples. B2M and UBC were used as housekeeping genes. A second additional experiment gave similar results. Panel C . Schematic representation of the VAV3 gene promoter. The location of the three CpG islands, the region amplified by BSP, and the ATG codon are indicated. Panel D . DNA methylation of the VAV3 promoter was determined by bisulfite sequencing PCR. Each dot represents the methylation status of a CpG dinucleotide in one sequenced BSP clone. Black dot, methylated CpG; white dot, unmethylated CpG. Panel E . VAV3 mRNA expression (left) and promoter methylation (right) across different breast cancer subtypes and normal mammary tissue were obtained from the TCGA database (*, P <0.05; ***, P <0.001). Panel F . Correlation analysis for VAV3 mRNA expression and VAV3 promoter methylation. No significant correlation was observed (Spearman rho = -0.10, P =0.14). TCGA, The Cancer Genome Atlas.
