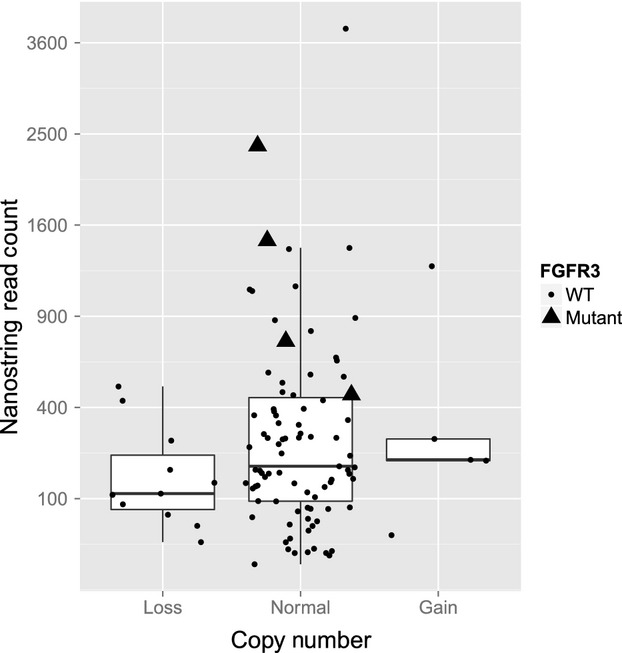
Figure 4.

FGFR3 copy number and mRNA expression for FGFR3 mutant and wild-type (WT) tumors. The Nanostring read counts for all patients with loss, gain, or normal FGFR3 copy numbers are visualized with dots for WT tumors and triangles for FGFR3 mutants. In addition, the distributions of read counts in the three categories are visualized with box plots.
