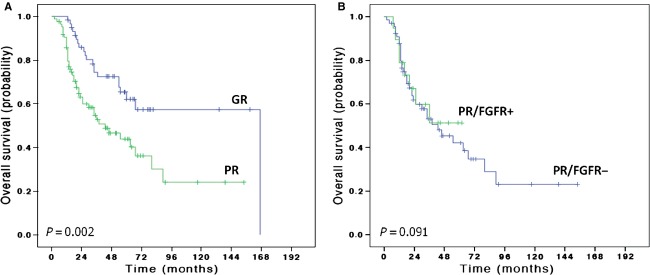
Figure 2.

Kaplan–Meier overall survival (OS) curves of 144 osteosarcoma patients treated with neo-adjuvant chemotherapy according to response to chemotherapy (A). GR, good response; PR, poor response. Kaplan–Meier OS curves of patients with a poor response to chemotherapy according FGFR status (FGFR1+ = FGFR1 amplification) (B).
