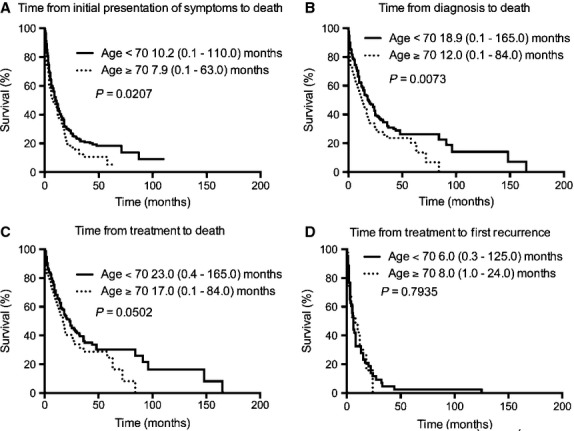
Figure 4.

Kaplan–Meier survival curves according to age. Four epochs were examined according to time from (A) initial presentation of symptoms to death, (B) time from diagnosis to death, (C) time from treatment to death, and (D) time from treatment to first recurrence.
