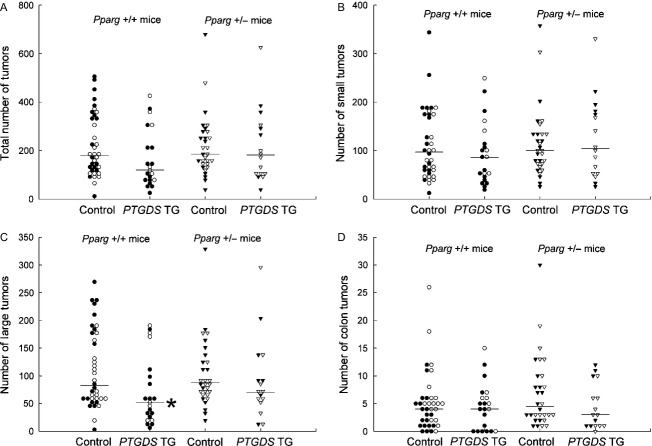
Figure 3.
Tumors in ApcMin/+ mice with PTGDS transgenes, with and without heterozygous Pparg knockouts (all 14 weeks). Data are for total (A), small (B), large (C), and colon tumors (D). There were statistically significant reductions in numbers of large tumors (C) in PTGDS transgenic mice without Pparg knockouts. See Table S3 for details. Pparg +/+ indicates no Pparg knockout. Pparg +/− indicates heterozygous Pparg knockout. Symbols are as in Figure2. *P < 0.025.

