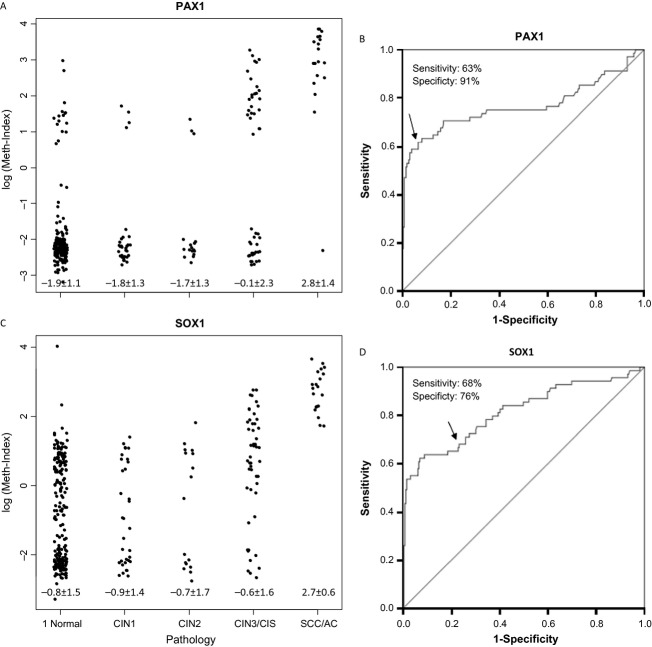
Figure 3.
Methylation index (meth-index) on a log scale of PAX1m (A) and SOX1m (B) levels from scrapings of the normal cervix and tumors graded as CIN1, CIN2, CIN3, CIS, or SCC/AC by histopathology (see key to Fig.1). Each dot represents the testing result of one patient. Receiver operating characteristic (ROC) curve analysis of PAX1m (C) and SOX1m (D). The area under the curve (AUC) of each gene's ROC curve was calculated for the diagnosis of CIN3 and worse (CIN3+) lesions.

