Correlation strength is interpreted as outlined by Johnston (
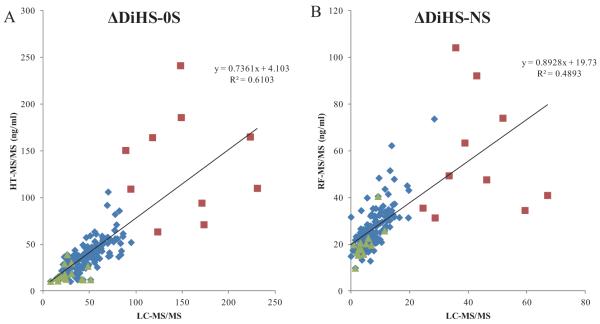
27). Correlations are interpreted based on r values as follows: 0.0 to 0.2, very weak to negligible correlation; 0.2 to 0.4, weak correlation; 0.4 to 0.7, moderate correlation; 0.7 to 0.9, strong correlation. Analysis was performed using SPSS for Windows (version 17.0, SPSS Inc., Chicago, IL, USA). Rectangle: normal controls, square: MPS II, triangle: MPS IVA.
ΔDiHS-NS concentration. Correlation in blood (plasma or serum) ΔDiHS-NS of human subjects between LC-MS/MS and HT-MS/MS is significant (Control n = 187, MPS IVA n = 17, MPS II n = 10, p<0.0001).
ΔDiHS-0S concentration. Correlation in blood (plasma or serum) ΔDiHS-0S of human subjects between LC-MS/MS and HT-MS/MS is significant (Control n = 187, MPS IVA n = 17, MPS II n = 10, p<0.0001).

