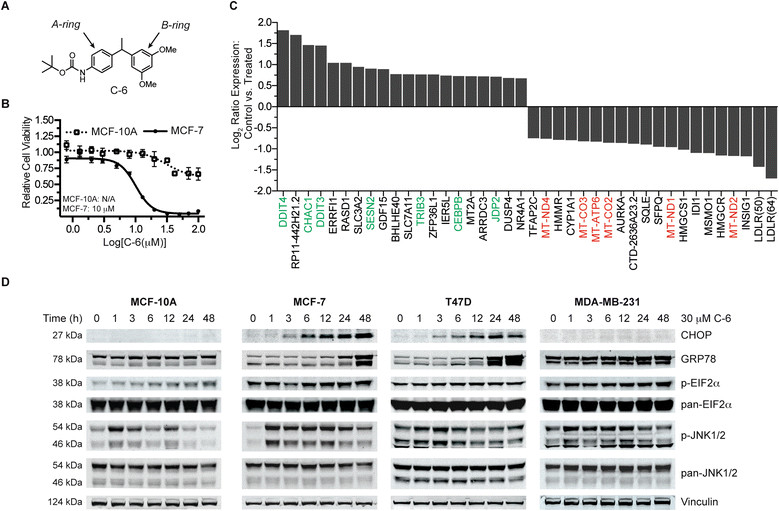
Figure 1.

Characterization of C-6-induced endoplasmic reticulum (ER) stress. (A) The anticancer small molecule C-6. (B) A dose-response analysis of C6-treated MCF-7 breast cancer cells and MCF-10A mammary epithelial cells measuring cell viability. Error bars represent the ± standard deviation of three replicates. (C) Analysis of the 20 most differentially expressed (upregulated and downregulated) MCF-7 transcripts following a 3-hour treatment with 30 μM C-6 (in triplicate). Results are plotted as a log2 ratio of the treated versus control samples. (D) Protein expression analysis of proteins associated with the ER stress response pathway following a time course treatment with 30 μM C-6.
