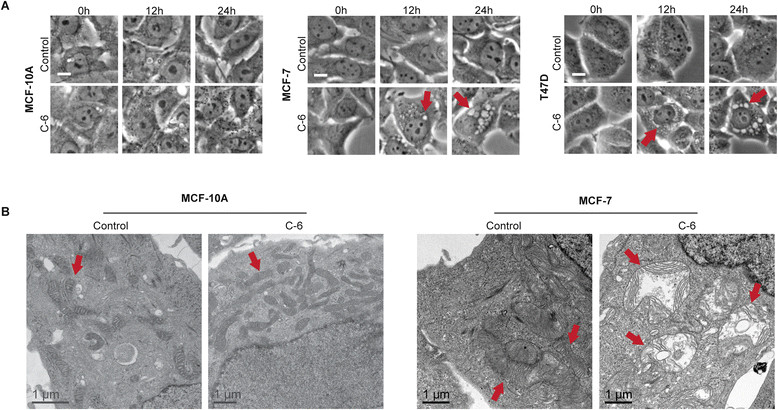
Figure 2.

C-6 affects mitochondrial morphology. (A) Phase contrast images of MCF-10A, MCF-7, and T47D cells following treatment with either 30 μM C-6 or a matched dimethyl sulfoxide (DMSO) vehicle control. Scale bar represents 10 μm. (B) Transmission electron microscopy images MCF-10A and MCF-7 cells following treatment with either 30 μM C-6 or a matched DMSO vehicle control for 24 hours. Arrows denote mitochondria.
