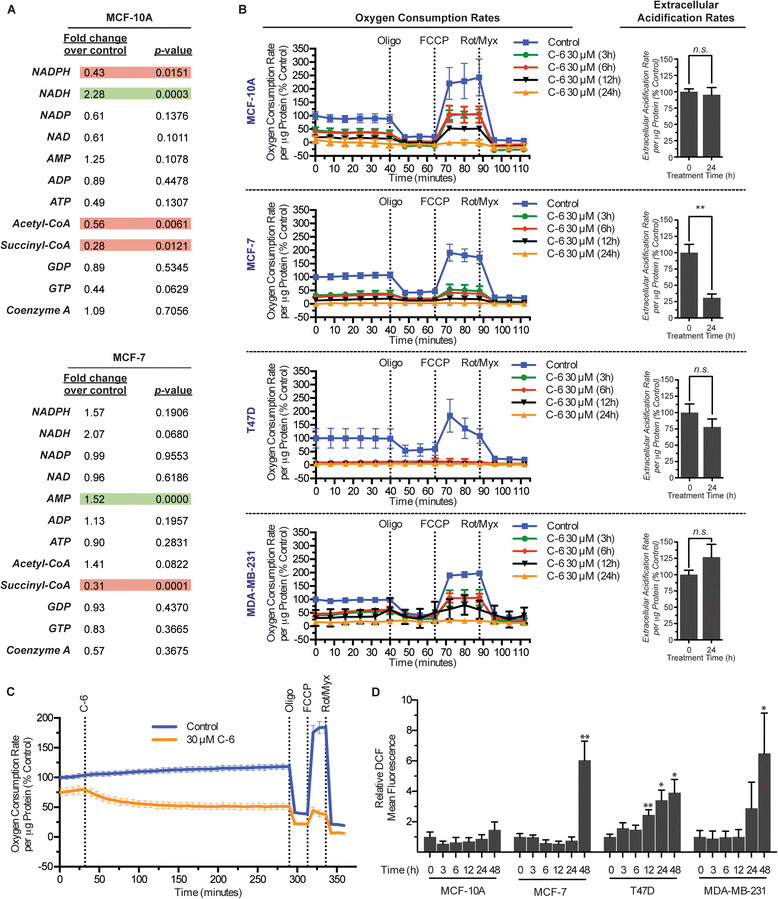
Figure 3.

C-6 disrupts metabolic homeostasis and energy production. (A) Metabolomic analysis of tricarboxylic acid (TCA) cycle intermediates following a 3-hour treatment with 30 μM C-6 or a matched dimethyl sulfoxide (DMSO) vehicle control. Values represent the average of six replicates. (B) Measurement of oxygen consumption and extracellular acidification rates following pretreatment of cells with C-6. (C) Measurement of oxygen consumption rates of MCF-7 cells with simultaneous addition of 30 μM C-6. (D) Quantification of : 2′,7′-dichlorodihydrofluorescein diacetate (H2DCFDA) oxidation by flow cytometry analysis. Normalized values represent the average mean fluorescence and ± standard deviation of three independent replicates. Asterisks, * and **, denote P values <0.05 and 0.01, respectively.
