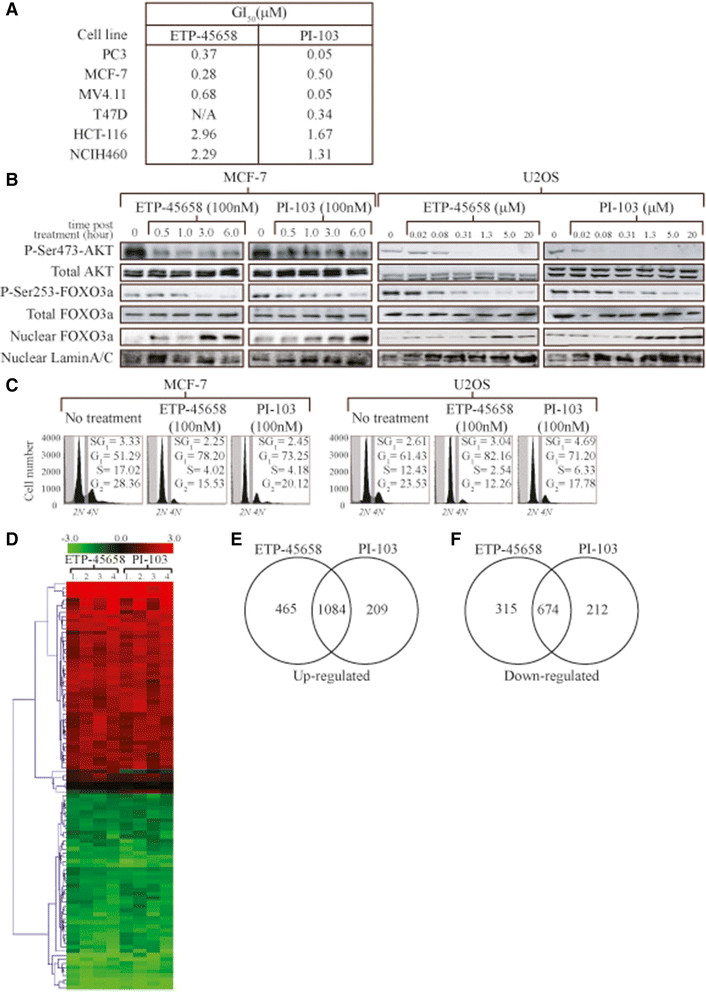
Figure 1.

Cellular response to ETP-45658. (A) Proliferation assay for each indicated cell line treated with serial dilutions of ETP-45658 or reference compound PI-103. Seventy-two hours post treatment, MTT assays were conducted. (B) Dose- and time-dependent analysis of Ser473 phosphorylation of AKT phosphorylation by 100nM ETP-45658 or PI-103 treatment. MCF-7 or U2OS cells were treated with the indicated concentrations (μM) of ETP-45658 (or PI-103) for four hours, then total protein was extracted and immunoblotted. For nuclear FOXO analysis, nuclear protein fractions were collected four hours post ETP-45658 (or PI-103) treatment. Nuclear FOXO3a levels were measure by immunoblotting. Nuclear fractions were confirmed by probing for lamin A/C. (C) FACS profile of MCF-7 or U2OS following 100 nM ETP-45658 treatment (20,000 events scored, N = 5). (D) Heat map for the top 100 differentially expressed genes based on hierarchical clustering using Euclidean distance metric. Red and green indicate genes that induced or repressed respectively by ETP-45658 or PI-103. Black indicates no change (N = 4). (E) Venn diagram of upregulated genes after ETP-45658 or PI-103 treatment (100nM). (F) Venn diagram of downregulated genes after ETP-45658 or PI-103 exposure. Numbers indicate number of genes that are exclusive to that particular category.
