
Figure 6.
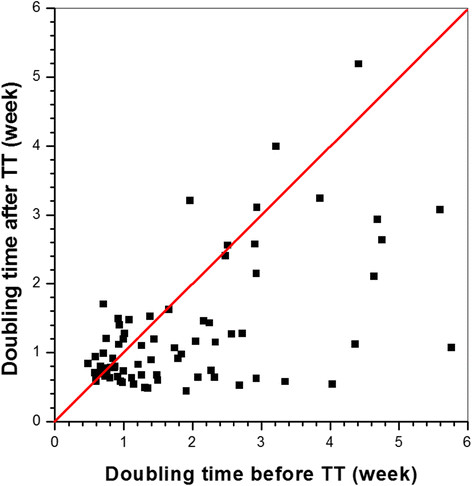
Doubling time calculated before and after the transition time for 74 lesions. Red line, the line at which the doubling time after the transition time (TT) = the doubling time before the TT.
Official websites use .gov
A
.gov website belongs to an official
government organization in the United States.
Secure .gov websites use HTTPS
A lock (
) or https:// means you've safely
connected to the .gov website. Share sensitive
information only on official, secure websites.
Doubling time calculated before and after the transition time for 74 lesions. Red line, the line at which the doubling time after the transition time (TT) = the doubling time before the TT.