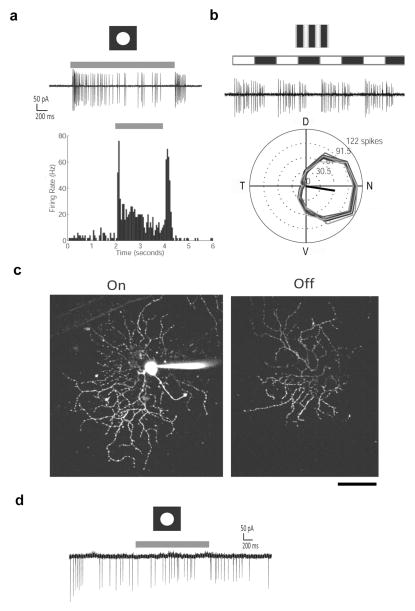
Figure 3. Examples of successful and unsuccessful experiments of two-photon targeted recording from GFP-expressing cells.
a–c An example experiment using a Drd4-GFP transgenic mouse, which expressed GFP in nasal-preferring On-OFF direction selective cells. Light-evoked spike responses were obtained from the GFP-positive cell using cell-attached recordings. Alexa 594 was added to the internal solution for labeling the dendritic morphology by two-photon imaging after the recording.
a. Light responses to stationary spots. Top trace, cell-attached recordings showing the On and Off spike responses to a 100 μm white spot centered on the soma. Lower graph, spike density histograms of corresponding on & off spike responses (10 repetitions, 50 ms bins). Grey bar represents the time of the spot stimuli.
b. Light responses to drifting gratings. Top trace, cell-attached recordings showing the On and Off spike responses to drifting gratings in the preferred direction. Lower graph, direction tuning curves (spike counts during 3s of gratings, 12 directions, 4 repetitions) show nasal preference to drifting gratings. The black arrow indicates the vector sum of spike responses.
c. Maximal intensity projections of Z-stack images of the same cell filled with Alexa 594 through a whole cell electrode showing the dendritic arbors in the On and Off sublaminae. Scale bar: 50 μm.
d. A cell-attached recording from a GFP-labeled cell from a Drd4-GFP mouse that was exposed to bright light from the halogen bulb through the condenser. The cell exhibited tonic firing, with no light-evoked responses to a 100 μm white spot centered on the soma, presumably due to photobleaching.

