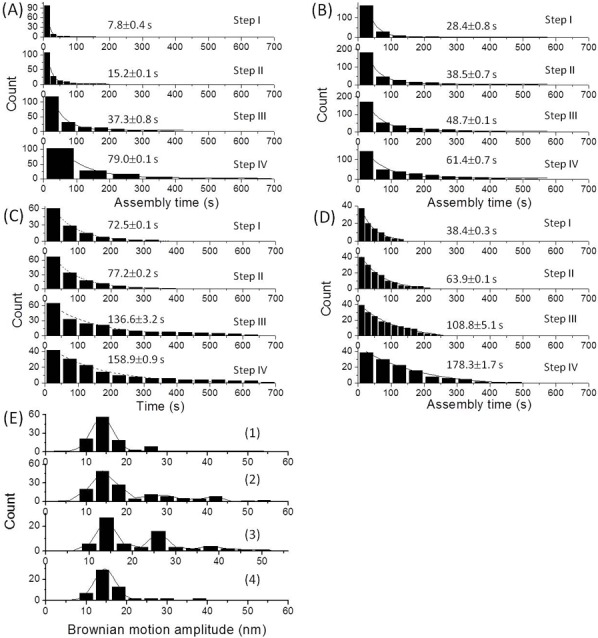
Figure 3. Kinetic analysis of the dwell times of the individual steps for a 836-bp DNA molecule in response to the histone octamer.

The histograms were constructed from the pooled distribution of dwell times for the assembly state illustrated in Fig. 1A (i)–(iv). (A) histone octamer only. (B) histone octamer along with Nap1. (C) histone octamer along with Asf1. (D) histone octamer along with PGA. The time constants were obtained from single-exponential fitting using Origin 8.0. All the time constants are listed in Table 1. (E) The distribution of BM amplitude for 836-bp DNA molecules in response to the addition of histone octamer (i) no chaperone (N = 111). in the presence of (ii) Nap1 (N = 139). (iii) Asf1 (N = 89). (iv) PGA (N = 57).
