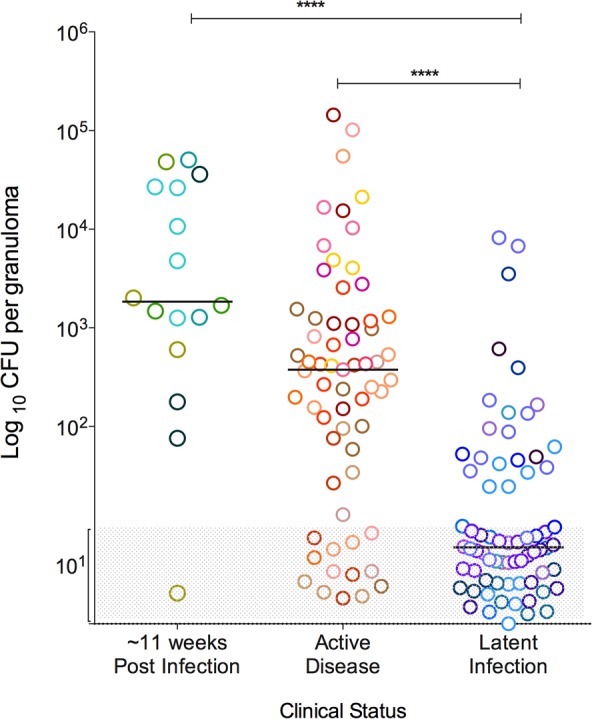
Figure 1. Bacterial burden of individual granulomas.

Bacterial burden is represented as the colony forming units (CFU) in logarithmic scale, per granuloma. Greyed area represents sterile granulomas (indicated as log10 1), which were assigned arbitrary range of values so that all granulomas can be seen in the graph. Each symbol represents a granuloma and a color represents granulomas from one animal. Granulomas are grouped as per the clinical status of the animal, where those animals that were infected for ∼11 weeks are in shades of green, active disease in shades of warm colors and latent infection in shades of cool colors. (****: p<0.0001, Dunn’s multiple test comparison).
