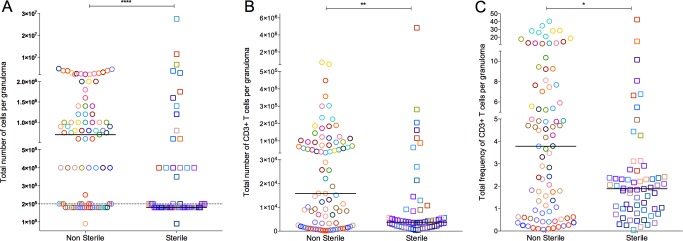
Figure 2. Absolute cell counts per granuloma.

A: Total number of cells obtained from granuloma. Granulomas with a cell count less than the detection limit was assigned 9×10⁴ before the correcting for the dilution factor. B: Total number of T cell counts, defined by CD3+ per granuloma. C is the total percentage of live CD3+ cell per granulomas and was used to extrapolate the absolute T cell count per granuloma (B) from the total granuloma cell count (A). Each symbol represents a granuloma. Each color represents an animal. Granulomas are grouped based on bacterial burden of the granuloma: non-sterile (Mtb cultured, in open circles) or sterile (in open squares). Solid line indicates median in each group. Dotted line indicates the detection limit (1×10⁵) before correcting for the dilution factor. (****: p<0.0001, **: p≤0.001, Non-parametric Mann-Whitney).
