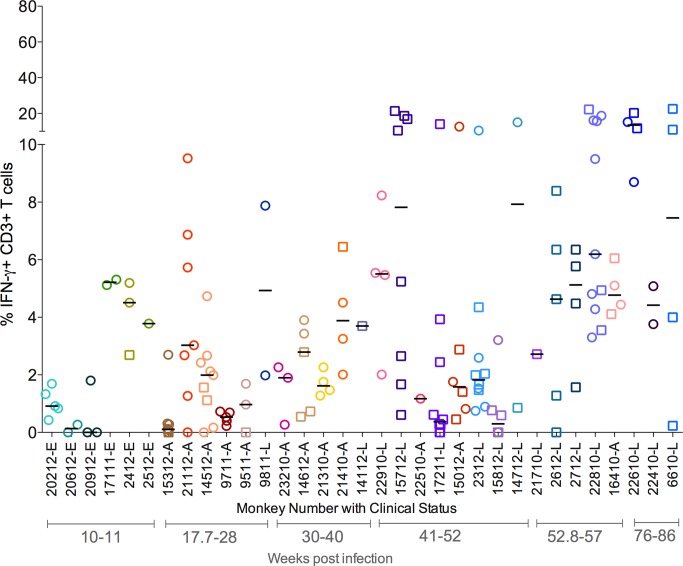
Figure 3. Proportion of T cells with IFN-γ response from each animal included in the study.
Each symbol represents an individual granuloma. Each individual granuloma had a distinct cytokine profile and there was a range of cytokine response in each animal. Similar responses were seen for other cytokines (S2 Fig.). Each symbol represents a granuloma. Each color represents an animal. Granulomas are marked based on bacterial burden of the granuloma: non-sterile (Mtb cultured, in open circles) or sterile (in open squares). Clinical status is represented for each animal along with monkey number [“E”: ∼11 weeks post infection; “A”: Active disease; “L”: Latent Infection]. Animals are arranged in the order of increasing post-Mtb infection time.

