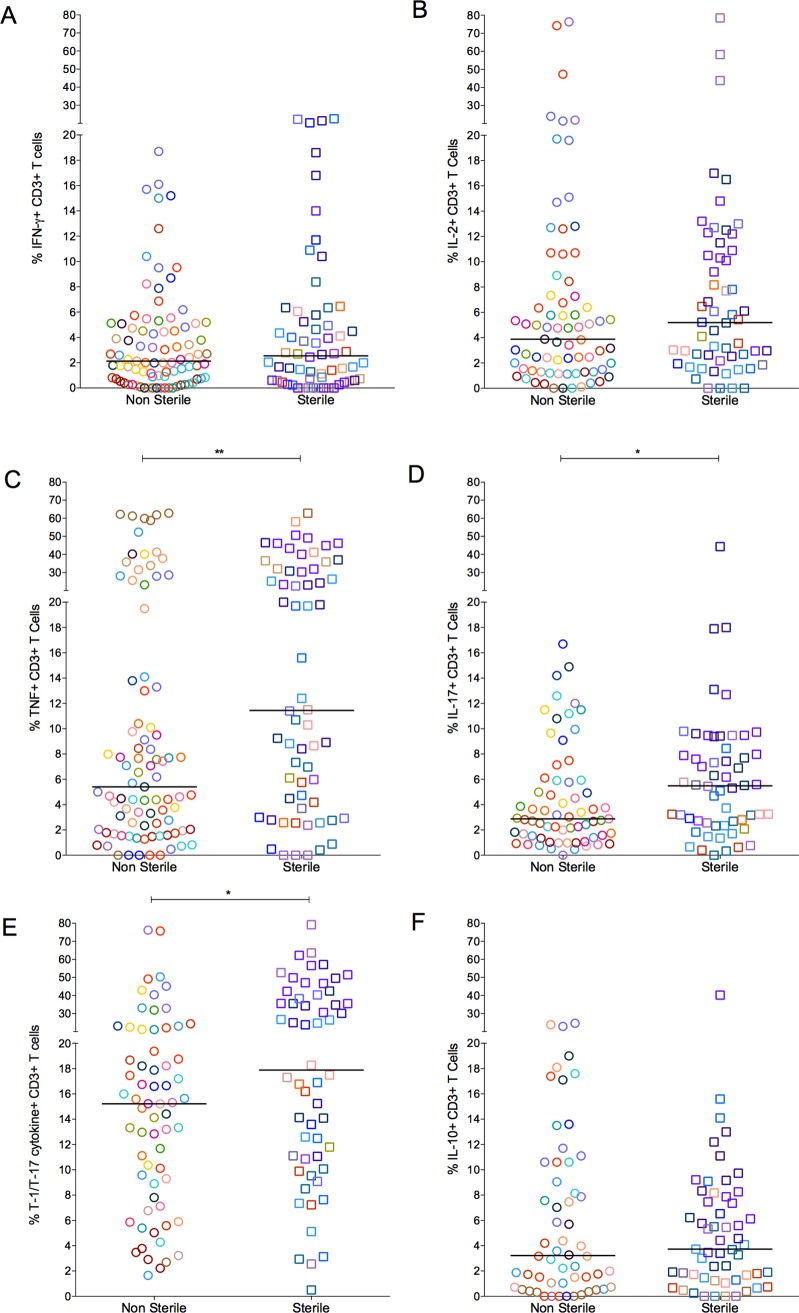
Figure 4. The proportion of T cells with cytokine response of IFN-γ (A), IL-2 (B), TNF (C), IL-17 (D), T-1/T-17 (E) and IL-10 (F).
Each symbol represents a granuloma. Each color represents an animal. Granulomas are marked and grouped based on bacterial burden of the granuloma: non-sterile in open circles and sterile in open squares. The frequency of cytokine producing T cells overlapped considerably between the groups (* = <0.05; **<0.01, Nonparametric Mann-Whitney test).

