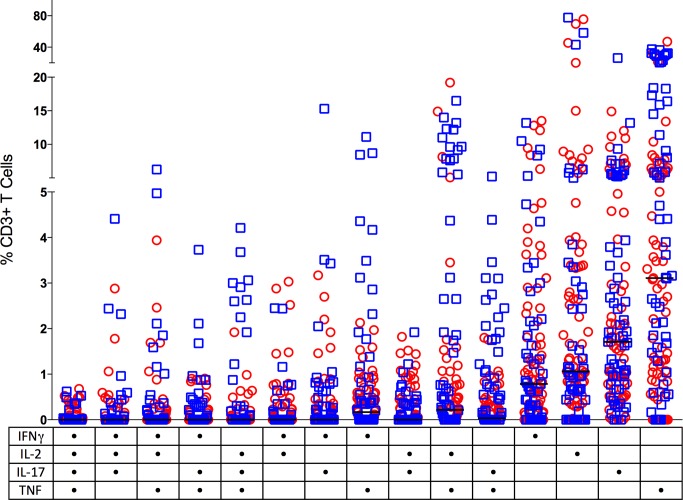
Figure 5. CD3+ T cells making single (one) or multiple (two, three or four) cytokines from individual granulomas.
Non-sterile granulomas are in open circles (red) and sterile granulomas are represented as open squares (blue). Solid line indicates median response. The table on the X axis reflects the groups positive for each cytokine represented by a dot. There was no significant difference between the multiple cytokine pattern of response between sterile and non-sterile granulomas or between various clinical states of the animal. (n = 121).

