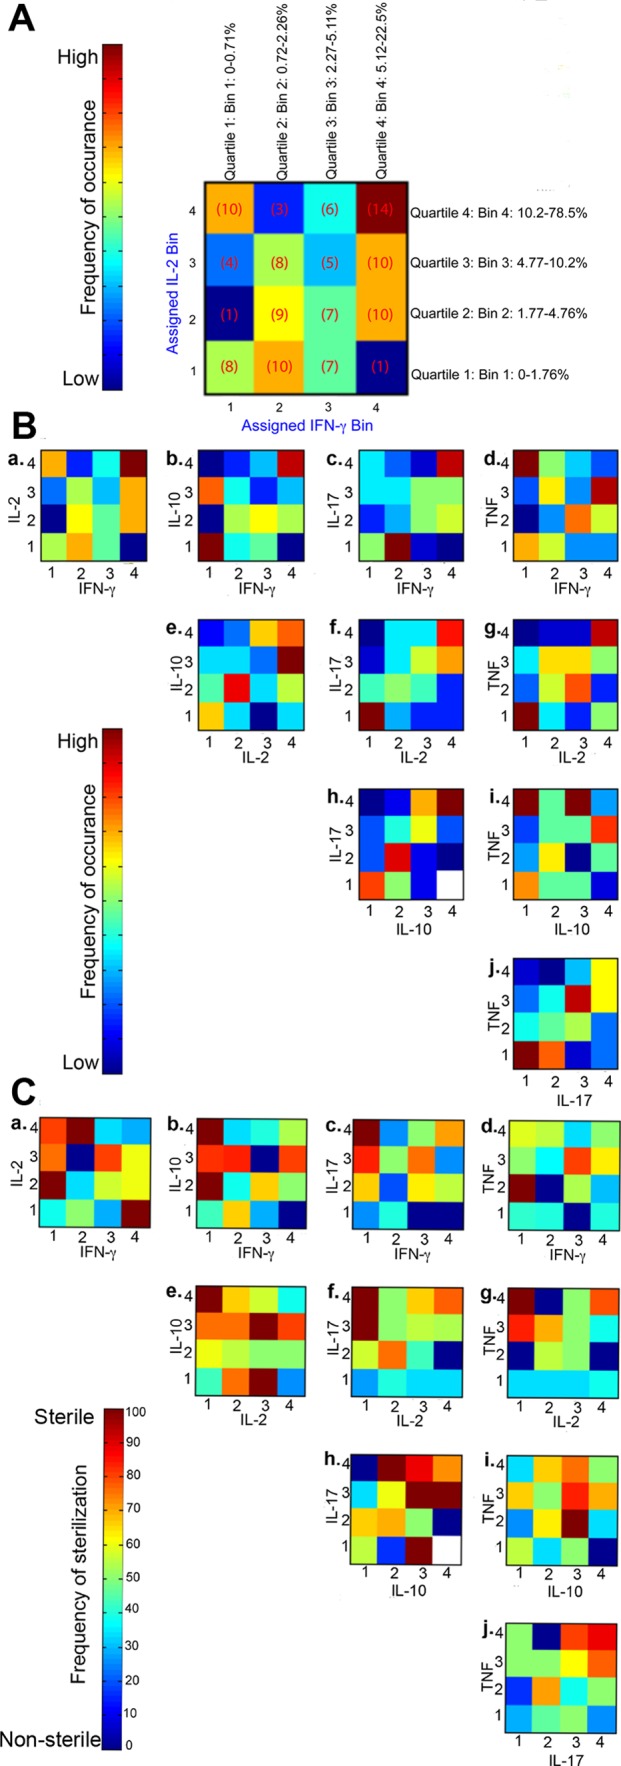
Figure 7. Pairwise occurrence matrix and sterilization frequency of T cell cytokines.

A is an example figure: For each cytokine variable of the granuloma, continuous percentage values were binned into one of four categories depending on quartile distribution (bins 1, 2, 3, or 4). Number of granulomas (number of times particular combination of binned cytokines occurred) in each of the bins were counted, for example, low IFN-γ (bin 1) and high IL-2 (bin 4) had 10 granulomas and summarized in a 4×4 co-occurrence matrix. For each pairwise cytokine comparison, the frequency of occurrence was summarized in heat-map form. B is the frequency of occurrence for all pairwise combination of T cell cytokines from individual granulomas. The scale represents the frequency of occurrence ranging from none/low to high. C is the sterilization frequency where matrices were constructed in a similar fashion by calculating the number of times sterilization occurred in a given particular cytokine combination and magnitude. Each square in each 4×4 heat-map therefore represents the frequency of sterilization under that particular combination of feature bins (# of sterilizing granulomas with cytokine A at level X and cytokine B at level Y out of total # of granulomas with cytokine A at level X and cytokine B at level Y). For each pairwise cytokine comparison, the frequency of sterilization under that particular combination of cytokines and levels is plotted and summarized in heat-map form. White squares indicate that granulomas with particular combination of cytokines at those levels did not occur.
