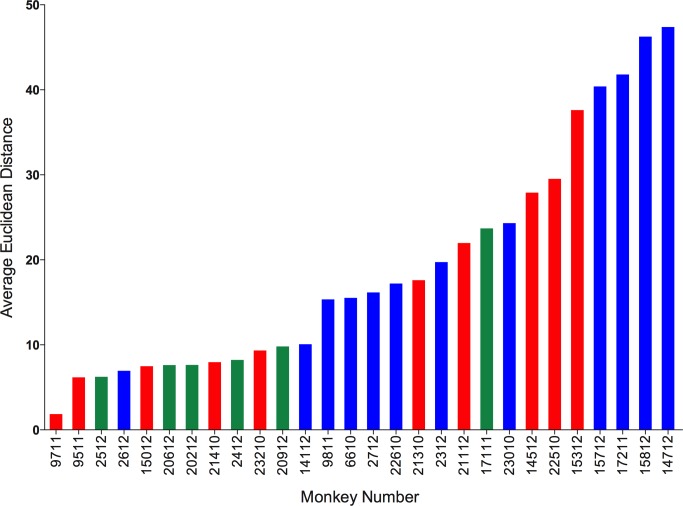
Figure 9. Systemic and local T cell responses.
Euclidean distance between T cell cytokines from blood (systemic) and each of the individual granulomas (local) of animal were calculated. The distances were averaged per animal and represented as the average Euclidean distance. Average Euclidean distance provides an estimate for “relatedness” between the systemic T cell response and local T cell response. Each bar represents an animal. Animals with active disease are represented in red, latent infection in blue and those infected for ∼11 weeks in green. Animals are arranged in increasing average Euclidean distance.

