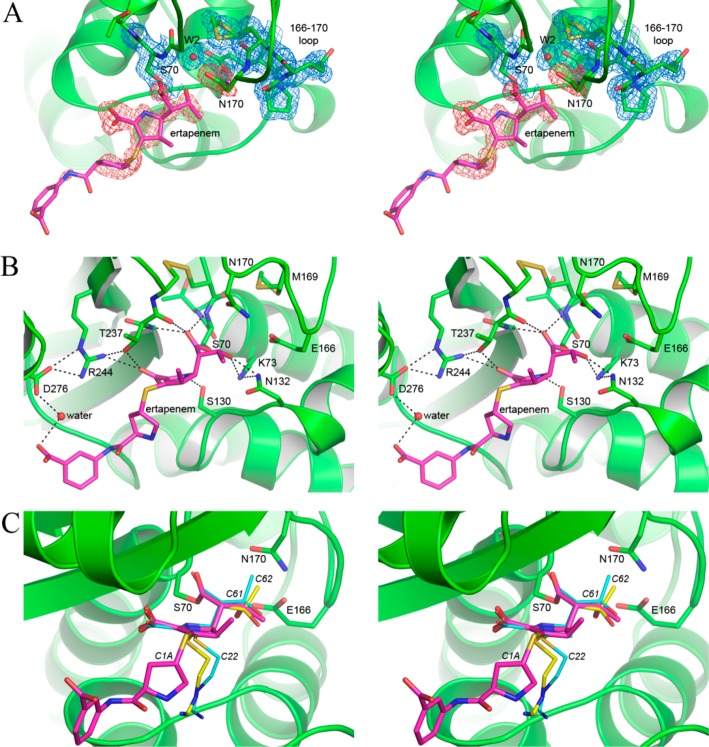
Figure 4.
GES-2-ertapenem structure. (A) Stereoview of the final 2Fo– Fc electron density (blue mesh) contoured at 1 σ for some of the GES-2 residues (green) in the active site. The ertapenem molecule (magenta sticks) is shown in the initial Fo– Fc difference density (pink mesh) calculated following molecular replacement, contoured at 2.5 σ. The side chain of Asn170 is also shown in the same Fo– Fc electron density map since this residue was truncated to a glycine in the MR model used. The deacylating water molecule (W2) is also indicated as a red sphere. (B) Stereoview of the hydrogen bonding interactions between ertapenem (magenta sticks) and the GES-2 protein (green). (C) Superposition of the imipenem complexes of GES-1 and GES-5 onto the ertapenem-GES-2 complex (green). Ertapenem is shown as thick magenta sticks and imipenem as thin yellow and cyan sticks for GES-1 and GES-5, respectively. The GES-1 and GES-5 proteins are not shown for clarity.

