
Figure 3.
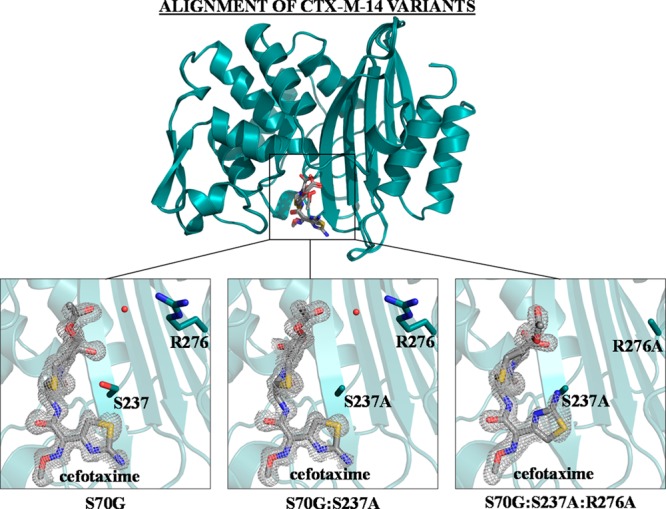
Electron density of cefotaxime in complex with the CTX-M-14 mutant enzymes. An alignment of CTX-M-14 mutants S70G, S70G:S237A, and S70G:S237A:R276A is shown on top, with the enzyme shown as teal ribbon and the substrate depicted as gray sticks. Below, the Fo – Fc difference map is shown in gray at 3σ. CTX-M-14 positions 237 and 276 are shown as teal sticks, with the enzyme shown in ribbon and cefotaxime shown in gray. The water molecule that forms hydrogen bonds with both Arg276 and cefotaxime in the S70G and S70G:S237A structures is displayed as a red sphere. Nitrogen atoms are shown in blue, oxygen atoms are shown in red, and sulfur atoms are shown in yellow. Images generated in PyMOL.29