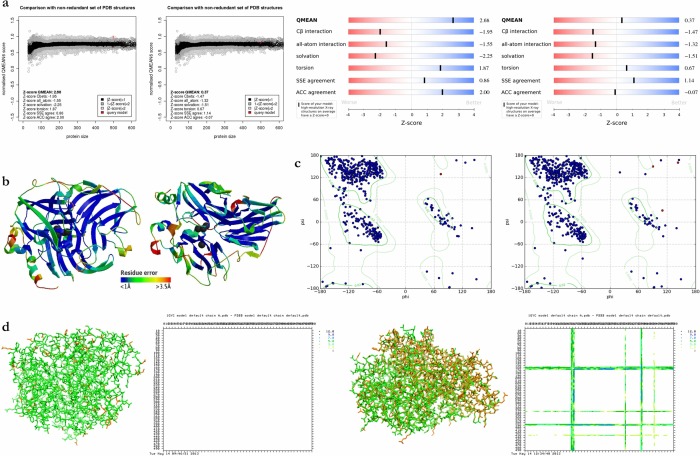
Figure 3. Model validation.
For all graphs from left to right, first for LaccGluc followed by LaccPost. a. QMEAN distribution and bar graphs. Distribution graphs illustrate QMEAN score tendencies from high-resolution PDB crystallographic structures. Bar graphs help identify “acceptable” or positive scores (blue) from “unacceptable” or negative scores (reed) for each description. b. 3D structure with color gradient from blue to red defining regions with resolutions between 1 and 3.5 Å respectively. The greater blue values represent a more reliable structure. c. Ramachandran plots. We inferred model residues make part of α-helices and β-sheet and beta turns since they occupy permitted spaces. Red points correspond to amino acids different than glycine and proline. d. Ball-and-stick model between the model and its template, DD matrices estimated by SuperPose. G. lucidum and P. ostreatus models in orange, 1GYC structure in green. Overlapping was visualized by Chimera. DD matrices demonstrated the comparison between model principal chains (x-axis) and the template (y-axis). Differences between 0 and 1.5 Å in white, between 1.5 and 3 Å in yellow, between 3 and 5 Å in light green, between 5 and 7 Å in turquoise, between 7 and 9 Å in dark blue and over 9 Å in black i.e. the darker the color the greater the distance difference between structures.

