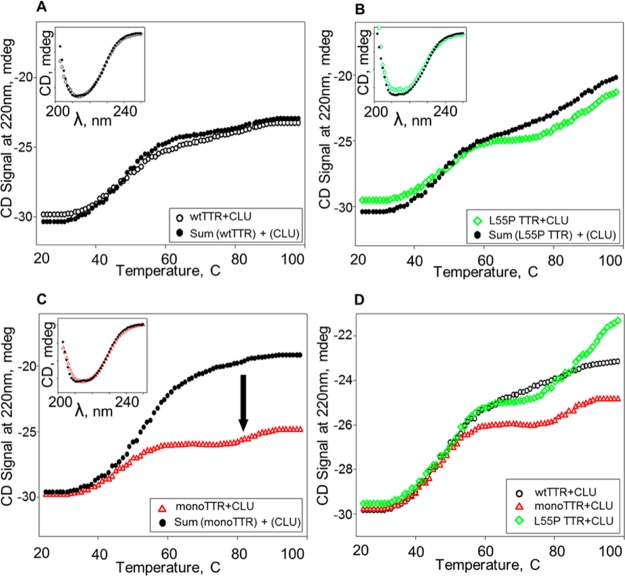
Figure 2.
Comparison of thermal unfolding data for equimolar mixtures of transthyretin (TTR) variants with clusterin (CLU). Secondary structural changes of each rTTR/CLU mixture during heating at a rate of 2 °C/min were obtained by continuous monitoring of the CD signal at 220 nm. Observed melting curves for equimolar mixtures of (A) wt, (B) L55P, and (C) monoTTR with CLU are shown as open black circles, green diamonds, and red triangles, respectively; each data set was compared to the corresponding sum of melting curves from the individual proteins (filled black circles). (D) Data from a direct comparison of observed melting curves for equimolar mixtures of CLU and wt, L55P, or monomeric rTTR are shown as open black circles, green diamonds, or red triangles, respectively.

