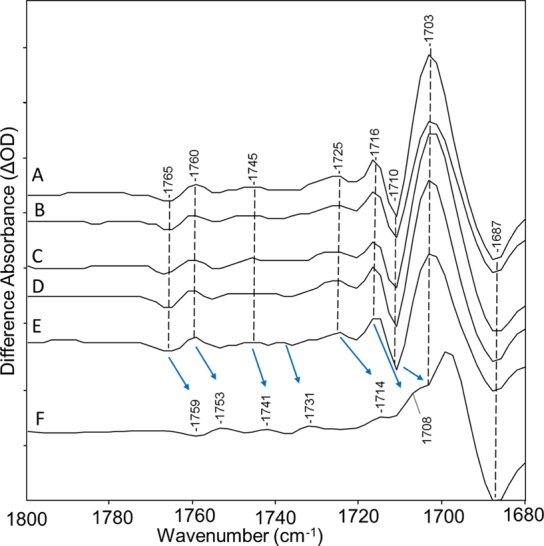
Figure 7.

Spectra from Figure 2 over the 1680–1800 cm–1 region: (A) CaChR1 in H2O, (B) CaChR1 in H2O regenerated with A1 retinal, (C) CaChR1 in H2O regenerated with A2 retinal, (D) CaChR1 in H2O regenerated with [15-13C,15-2H]retinal, (E) CaChR1 in H2O regenerated with [14,15-2H2]retinal, and (F) CaChR1 in D2O. Arrows indicate shifts of difference bands due to H–D exchange. Y axis markers are approximately 0.5 mOD for all spectra. See the discussion in the Supporting Information regarding results shown in spectra B–F.
