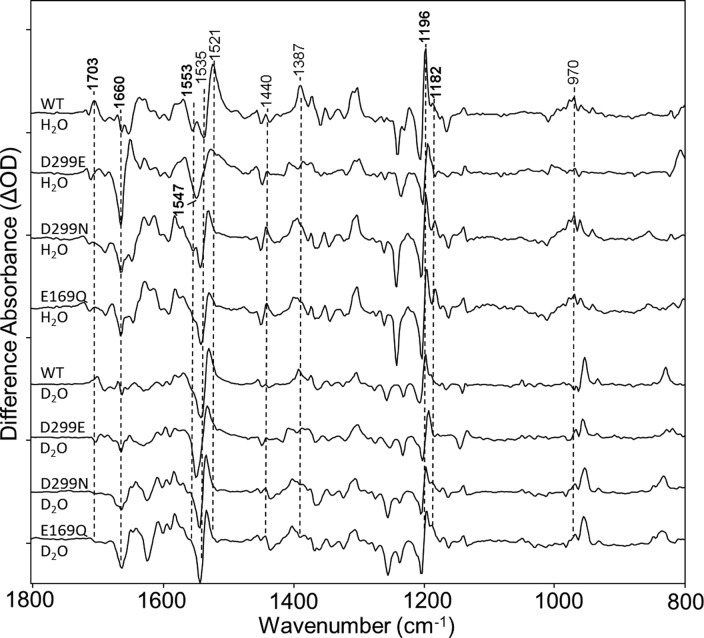
Figure 8.
Comparison of CaChR1 and the D299N, E169Q, and D299E mutants over the region from 800 to 1800 cm–1. The top four spectra were recorded in H2O and the bottom four in D2O. All spectra were acquired as described previously. Peaks labeled in bold are discussed in the text. Y axis markers are approximately 3 mOD for WT, 2 mOD for D299E, 2.5 mOD for D299N, and 1 mOD for E169Q. For detailed H–D exchange and site-directed mutagenesis procedures, see Materials and Methods.

