Figure 6.

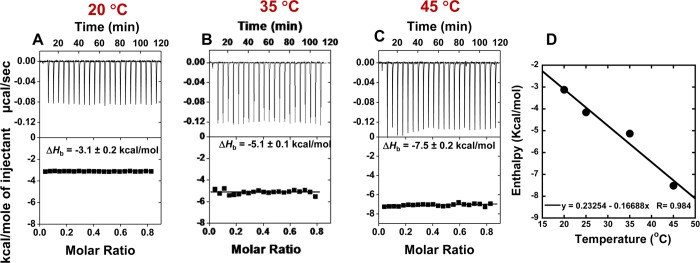
(A–C) ITC data for the titration of DB2277 and AAAGTTT DNA at different experimental temperatures. (D) Plot of ΔHb versus temperature for DB2277 with AAAGTTT DNA, and the linear fit yields a ΔCp of −172 ± 5 cal M–1 K–1.

(A–C) ITC data for the titration of DB2277 and AAAGTTT DNA at different experimental temperatures. (D) Plot of ΔHb versus temperature for DB2277 with AAAGTTT DNA, and the linear fit yields a ΔCp of −172 ± 5 cal M–1 K–1.